
Mulgrave Mill: Difference between revisions
| Line 41: | Line 41: | ||
* '''Diesel:''' The fleet was modernised with Clyde and Com-Eng diesel hydraulic units. Notable locomotives include "Mulgrave" (Walkers GH500), which is one of the largest hydraulic locomotives in the Australian sugar industry. | * '''Diesel:''' The fleet was modernised with Clyde and Com-Eng diesel hydraulic units. Notable locomotives include "Mulgrave" (Walkers GH500), which is one of the largest hydraulic locomotives in the Australian sugar industry. | ||
== Production | == Production statistics == | ||
Published production figures are not available on a consistent basis for every season. Earlier sources generally report total cane crushed at the mill, while recent CANEGROWERS statistics are normally organised by ''mill area''. These measures can differ when cane assigned to another district is processed at Mulgrave. | |||
Following the cessation of crushing at [[Mossman]] after the 2023 season, Mulgrave began processing road-hauled Mossman cane in 2024. In that season, the Mulgrave mill area produced 782,739 tonnes, while total physical throughput at Mulgrave was 968,391 tonnes after cane from outside the mill area was included.<ref name="CG2024">CANEGROWERS, [https://www.canegrowers.com.au/uploads/Annual-Report/Annual-report-2024-25.pdf ''Annual Report 2024–25''], table of Australian cane and sugar production.</ref><ref name="QCAR2024">Queensland Cane Agriculture and Renewables, [https://qcar.org.au/wp-content/uploads/2019/06/Crush-Statistics-22-January-2025.pdf ''Crush Statistics and Production Figures'', 22 January 2025].</ref> | |||
{| class="wikitable mw-collapsible" | |||
|+ Documented annual production | |||
! Year | |||
! Cane tonnage | |||
! CCS | |||
! Basis and notes | |||
|- | |||
| | |||
|- | |- | ||
| | | 1990 | ||
| | | approximately 706,000 | ||
| | | — | ||
| | | Contemporary Queensland Parliamentary reporting stated that Mulgrave crushed approximately 706,000 tonnes in 1990.<ref name="Hansard1991">Queensland Parliament, [https://documents.parliament.qld.gov.au/events/han/1991/911127ha.pdf ''Parliamentary Debates'', 27 November 1991], discussion of the Hambledon closure and Mulgrave throughput.</ref> | ||
|- | |- | ||
| | | 1991 | ||
| | | 592,435 | ||
| | | — | ||
|Final | | Final season of the nearby Hambledon Mill. Hambledon crushed 464,813 tonnes before closing.<ref name="QSC1993">Queensland Sugar Corporation, [https://www.parliament.qld.gov.au/Work-of-the-Assembly/Tabled-Papers/docs/4795t5679/4795t5679.pdf annual report], Appendix A: Cane Crushed.</ref> | ||
|- | |- | ||
| | | 1992 | ||
|1, | | 1,327,981 | ||
| | | — | ||
| | | First season after Mulgrave assumed the processing of cane formerly supplied to Hambledon.<ref name="QSC1993" /> | ||
|- | |- | ||
| | | 1993 | ||
|1, | | 1,392,103 | ||
| | | 11.82 | ||
| | | CANEGROWERS season statistics. A Queensland Sugar Corporation table gives the slightly different figure of 1,390,396 tonnes.<ref name="CG1993">CANEGROWERS, [https://www.parliament.qld.gov.au/Work-of-the-Assembly/Tabled-Papers/docs/4794t4458/4794t4458.pdf ''1993 Season Statistics''].</ref><ref name="QSC1993" /> | ||
|- | |- | ||
| | | 1997 | ||
| | | 1,275,000 | ||
| | | — | ||
| | | Mill throughput reported by the Far North Queensland Sugar Industry Task Force.<ref name="FNQTaskForce">Far North Queensland Sugar Industry Task Force, [https://elibrary.sugarresearch.com.au/bitstreams/e11303ee-2b2c-4ebf-a118-1bcd4ba46542/download ''Statistical Picture of the Far North Queensland Sugar Industry in 1999''].</ref> | ||
|- | |- | ||
| | | 1998 | ||
| | | 1,430,000 | ||
| | | — | ||
| | | Mill throughput reported by the Far North Queensland Sugar Industry Task Force.<ref name="FNQTaskForce" /> | ||
|- | |- | ||
| | | 1999 | ||
|1, | | 1,330,000 | ||
| | | — | ||
| | | Mill throughput reported by the Far North Queensland Sugar Industry Task Force.<ref name="FNQTaskForce" /> | ||
|- | |- | ||
| | | 2001 | ||
|1, | | 1,011,249 | ||
|13. | | 13.77 | ||
| | | Yield averaged 74.00 tonnes per hectare. Greyback cane grub damage was estimated to have reduced the crop by approximately 68,000 tonnes.<ref name="Mulgrave2001">Mulgrave Central Mill Company, [https://www.parliament.qld.gov.au/Work-of-the-Assembly/Tabled-Papers/docs/5002T3927/5002t3927.pdf ''Annual Report, January 2001–June 2002''].</ref> | ||
|- | |- | ||
| | | 2010 | ||
|1, | | 1,086,000 | ||
| | | 11.79 | ||
| | | Final crop figure reported in an industry assessment; approximately 6,000 tonnes was condemned.<ref name="SRA2011Assessment">BSES Limited, [https://elibrary.sugarresearch.com.au/bitstreams/66c1c83e-0426-46c8-9954-7f6d2a1e763f/download post-cyclone crop assessment], Appendix 4: Mulgrave Mill area.</ref> | ||
|- | |- | ||
| | | 2014 | ||
|1, | | approximately 1,032,251 | ||
| | | approximately 12.72 | ||
| | | End-of-season estimate published shortly after Mulgrave completed crushing on 16 November.<ref name="ACFA2014">Australian Cane Farmers Association, [https://www.acfa.com.au/wp-content/uploads/2014/12/Northern_Gerard-Puglisi_FINAL.pdf northern region report], December 2014.</ref> | ||
|- | |- | ||
| | | 2015 | ||
|1, | | 1,443,444 | ||
|12. | | 12.77 | ||
| | | CANEGROWERS mill-area series.<ref name="CG201617">CANEGROWERS, [https://wetlandinfo.detsi.qld.gov.au/resources/static/pdf/ecology/catchment-stories/lower-burdekin/canegrowers2017.pdf ''Annual Report 2016–17''], table of Australian production in the 2015 and 2016 seasons.</ref> | ||
|- | |- | ||
| | | 2016 | ||
|1, | | 1,521,612 | ||
| | | 11.23 | ||
| | | CANEGROWERS mill-area series. This was reported as a record crop at the time.<ref name="CG201617" /> | ||
|- | |- | ||
| | | 2017 | ||
| | | 1,300,066 | ||
| | | 12.16 | ||
| | | Final mill result reported by MSF Sugar. The crop was lower than the 2016 result.<ref name="MSF2017">MSF Sugar, [https://www.marketscreener.com/news/latest/MSF-Sugar-Crushing-Season-a-Success-Despite-Reduced-Tonnages-25702947/ ''Crushing Season a Success Despite Reduced Tonnages''], December 2017.</ref> | ||
|- | |- | ||
| | | 2018 | ||
| | | 976,449 | ||
| | | 14.49 | ||
| | | Sugar Research Australia figure compiled from data supplied by Australian sugar mills. The CANEGROWERS annual report gives a slightly different CCS figure of 14.29.<ref name="SRA2018">Sugar Research Australia, [https://sugarresearch.com.au/wp-content/uploads/2019/07/Harvesting-details-for-Qld-and-NSW-2018-season.pdf ''Harvesting Details — 2018 Season''].</ref><ref name="CG201920">CANEGROWERS, [https://www.canegrowers.com.au/uploads/Publications/Annual-Reports/321340_canegrowers-annual-report-2019-20.pdf ''Annual Report 2019–20''], table of Australian production in the 2018 and 2019 seasons.</ref> | ||
|- | |- | ||
| | | 2019 | ||
| | | 888,878 | ||
|12. | | 12.94 | ||
| | | CANEGROWERS mill-area series.<ref name="CG201920" /> | ||
|- | |- | ||
| | | 2020 | ||
| | | 1,002,143 | ||
| | | 12.41 | ||
| | | CANEGROWERS mill-area series.<ref name="CG202021">CANEGROWERS, [https://www.canegrowers.com.au/uploads/Publications/Annual-Reports/328044_canegrowers-annual-report-2020-21.pdf ''Annual Report 2020–21''], table of Australian production in the 2019 and 2020 seasons.</ref> | ||
|- | |- | ||
| | | 2021 | ||
| | | 943,354 | ||
| | | 11.62 | ||
| | | CANEGROWERS mill-area series.<ref name="CG202122">CANEGROWERS, [https://www.canegrowers.com.au/uploads/Publications/Annual-Reports/334371_canegrowers-annual-report-2021-22.pdf ''Annual Report 2021–22''], table of Australian production in the 2020 and 2021 seasons.</ref> | ||
|- | |- | ||
| | | 2022 | ||
|1, | | 1,016,543 | ||
| | | 12.48 | ||
| | | CANEGROWERS mill-area series.<ref name="CG202223">CANEGROWERS, [https://www.canegrowers.com.au/uploads/Publications/Annual-Reports/338770_canegrowers-annual-report-2022-23.pdf ''Annual Report 2022–23''], table of Australian production in the 2021 and 2022 seasons.</ref> | ||
|- | |- | ||
| | | 2023 | ||
| | | 1,004,086 mill-area cane;<br />approximately 1,175,721 total throughput | ||
| | | 11.98 for Mulgrave-area cane | ||
| | | In addition to the Mulgrave-area crop, Mulgrave processed 171,635 tonnes assigned to South Johnstone. Cyclone Jasper occurred after the crush and affected the following crop; it did not terminate Mulgrave's 2023 season.<ref name="CG202324">CANEGROWERS, [https://www.canegrowers.com.au/uploads/Annual-Report/QCGO-2023-24-Annual-Report.pdf ''Annual Report 2023–24''], production table and Innisfail district report.</ref> | ||
|- | |- | ||
| | | 2024 | ||
| | | 782,739 mill-area cane;<br />968,391 total throughput | ||
| | | 12.49 mill-area;<br />12.41 total throughput | ||
| | | First season processing cane transported from the former Mossman supply area. Total mill throughput was reported separately by Queensland Cane Agriculture and Renewables.<ref name="CG2024" /><ref name="QCAR2024" /> | ||
|} | |} | ||
Revision as of 18:28, 26 August 2026
| Mulgrave Mill | |
|---|---|
|
| |
| Location | |
| Coordinates | 17.09183° S, 145.78959° E |
| State | Queensland |
| Region | Northern Region |
| LGA | Cairns Regional Council |
| Details | |
| Established | 1893 (133 years ago) |
| Owner | MSF Sugar |
| Gauge | 610 mm (2 ft) |
| Annual Crush | 1,100,000 tonnes, seasonal average |

Mulgrave Sugar Mill (formerly the Mulgrave Central Mill) is a sugar mill located in Gordonvale, approximately 20 kilometres south of Cairns, Queensland. Established in 1893, it served as a cornerstone of the Cairns district economy for over a century as a grower owned cooperative.[1] The mill is notable for its survival and growth following the closure of neighbouring facilities at Hambledon (1991) and Babinda (2011).
History
Establishment
Following the enactment of the Sugar Works Guarantee Act 1893, local farmers in the Mulgrave district petitioned the Queensland Government for a loan to establish a central mill. Richard Blackwell donated 15 acres of land for the mill site, and the Mulgrave Central Mill Company Limited was registered in 1895.[2]
The contract for the mill's construction was awarded to the Scottish engineering firm A & W Smith of Glasgow. The first crushing season commenced in late 1896, processing 16,000 tons of cane for a yield of 1,311 tons of sugar. Early operations were hampered by the lack of a government railway connection, necessitating the construction of an extensive tramway system to transport sugar to the Cairns wharves.[3]
Operational History
By the early 1900s, the Mulgrave Mill was recognised as one of the most successful projects funded under the 1893 Act. In 1911, the mill directors successfully negotiated the purchase of the Cairns to Mulgrave Tramway from the Cairns Shire Council, which was subsequently sold to the Queensland Government for incorporation into the North Coast Line.[4]
During the Second World War, the mill and the town of Gordonvale became a significant hub for American military forces. The mill's logistical infrastructure was utilised to support the war effort in the South West Pacific.[5]
The mill's supply area expanded significantly in 1991 following the closure of the Hambledon Mill in Edmonton. This closure resulted in approximately 400,000 tonnes of cane being diverted to Mulgrave, requiring substantial capital investment in the milling train and transport infrastructure to handle the increased throughput.
Ownership
In 2008, the Mulgrave Central Mill Company Limited ceased to be a grower cooperative when it was acquired by the Maryborough Sugar Factory (MSF).[6] Following this acquisition, the mill was no longer designated as a "central" mill.
In 2011, MSF Sugar also acquired the South Johnstone Mill. Following the severe impact of Cyclone Yasi in February 2011, MSF made the strategic decision to close the Babinda Mill. The closure allowed MSF to rationalise operations by transferring the Babinda crop to the Mulgrave and South Johnstone facilities. In 2012, the entire MSF Sugar group was acquired by the Thai multinational Mitr Phol.[7]
Infrastructure
Tramway
Mulgrave Mill operates an extensive 610 mm (2 ft) gauge tramway network. The system is highly interconnected, linking with the former Hambledon Mill network to the north and the Babinda Mill network to the south.
Rolling Stock
The locomotive fleet has historically featured a diverse range of motive power.
- Steam: In the early 20th century, the mill relied on steam locomotives such as the Hudswell Clarke 0-6-0 models.
- Diesel: The fleet was modernised with Clyde and Com-Eng diesel hydraulic units. Notable locomotives include "Mulgrave" (Walkers GH500), which is one of the largest hydraulic locomotives in the Australian sugar industry.
Production statistics
Published production figures are not available on a consistent basis for every season. Earlier sources generally report total cane crushed at the mill, while recent CANEGROWERS statistics are normally organised by mill area. These measures can differ when cane assigned to another district is processed at Mulgrave.
Following the cessation of crushing at Mossman after the 2023 season, Mulgrave began processing road-hauled Mossman cane in 2024. In that season, the Mulgrave mill area produced 782,739 tonnes, while total physical throughput at Mulgrave was 968,391 tonnes after cane from outside the mill area was included.[8][9]
| Year | Cane tonnage | CCS | Basis and notes |
|---|---|---|---|
| 1990 | approximately 706,000 | — | Contemporary Queensland Parliamentary reporting stated that Mulgrave crushed approximately 706,000 tonnes in 1990.[10] |
| 1991 | 592,435 | — | Final season of the nearby Hambledon Mill. Hambledon crushed 464,813 tonnes before closing.[11] |
| 1992 | 1,327,981 | — | First season after Mulgrave assumed the processing of cane formerly supplied to Hambledon.[11] |
| 1993 | 1,392,103 | 11.82 | CANEGROWERS season statistics. A Queensland Sugar Corporation table gives the slightly different figure of 1,390,396 tonnes.[12][11] |
| 1997 | 1,275,000 | — | Mill throughput reported by the Far North Queensland Sugar Industry Task Force.[13] |
| 1998 | 1,430,000 | — | Mill throughput reported by the Far North Queensland Sugar Industry Task Force.[13] |
| 1999 | 1,330,000 | — | Mill throughput reported by the Far North Queensland Sugar Industry Task Force.[13] |
| 2001 | 1,011,249 | 13.77 | Yield averaged 74.00 tonnes per hectare. Greyback cane grub damage was estimated to have reduced the crop by approximately 68,000 tonnes.[14] |
| 2010 | 1,086,000 | 11.79 | Final crop figure reported in an industry assessment; approximately 6,000 tonnes was condemned.[15] |
| 2014 | approximately 1,032,251 | approximately 12.72 | End-of-season estimate published shortly after Mulgrave completed crushing on 16 November.[16] |
| 2015 | 1,443,444 | 12.77 | CANEGROWERS mill-area series.[17] |
| 2016 | 1,521,612 | 11.23 | CANEGROWERS mill-area series. This was reported as a record crop at the time.[17] |
| 2017 | 1,300,066 | 12.16 | Final mill result reported by MSF Sugar. The crop was lower than the 2016 result.[18] |
| 2018 | 976,449 | 14.49 | Sugar Research Australia figure compiled from data supplied by Australian sugar mills. The CANEGROWERS annual report gives a slightly different CCS figure of 14.29.[19][20] |
| 2019 | 888,878 | 12.94 | CANEGROWERS mill-area series.[20] |
| 2020 | 1,002,143 | 12.41 | CANEGROWERS mill-area series.[21] |
| 2021 | 943,354 | 11.62 | CANEGROWERS mill-area series.[22] |
| 2022 | 1,016,543 | 12.48 | CANEGROWERS mill-area series.[23] |
| 2023 | 1,004,086 mill-area cane; approximately 1,175,721 total throughput |
11.98 for Mulgrave-area cane | In addition to the Mulgrave-area crop, Mulgrave processed 171,635 tonnes assigned to South Johnstone. Cyclone Jasper occurred after the crush and affected the following crop; it did not terminate Mulgrave's 2023 season.[24] |
| 2024 | 782,739 mill-area cane; 968,391 total throughput |
12.49 mill-area; 12.41 total throughput |
First season processing cane transported from the former Mossman supply area. Total mill throughput was reported separately by Queensland Cane Agriculture and Renewables.[8][9] |
Location
Rollingstock
| Name | Builder | Model | Serial | Year | Current Mill | Notes |
|---|---|---|---|---|---|---|
| 11 / Maitland | E.M. Baldwin | DH18 Mk2 | 4413-2-8-72 | 1972 | Mulgrave Mill | Was Hambledon #1 |
| 13 | Clyde | HG-3R | 64-316 | 1964 | Mulgrave Mill | Was Hambledon #3 |
| 14 | Clyde | DHI-71 | 56-86 | 1956 | Mulgrave Mill | Was Hambledon #4 |
| 15 | Clyde | DHI-71 | 58-190 | 1958 | Mulgrave Mill | Was Hambledon #5. Scrapped - 1998 |
| 16 / Kamma | Clyde | DHI-71 | 56-96 | 1956 | Mulgrave Mill | Was Hambledon #6 |
| 18 / Barron | Clyde | HG-3R | 64-379 | 1964 | Mulgrave Mill | Was Hambledon #8 |
| 19 / Redlynch | Clyde | HG-3R | 65-435 | 1965 | Mulgrave Mill | Was Hambledon #9 |
| 3 | Commonwealth Engineering | AA | A1003 | 1955 | Out of service | Retired 2018 |
| 5 | Commonwealth Engineering | AA | A1005 | 1955 | Mulgrave Mill | |
| 6 | Commonwealth Engineering | AA | A1006 | 1955 | Mulgrave Mill | |
| 7 / Highleigh | Commonwealth Engineering | AA | B1010 | 1955 | Mulgrave Mill | |
| 8 / Charringa | Commonwealth Engineering | AA | A1926 | 1958 | Mulgrave Mill | |
| 9 / Meerawa | Commonwealth Engineering | FC | FC3473 | 1964 | Mulgrave Mill | |
| 10 | E.M. Baldwin | DH6-PS | 6-881-1-6-64 | 1964 | Mulgrave Mill | |
| Gordonvale | Walkers | GH500 | 595 | 1968 | Mulgrave Mill | Converted by Bundaberg Foundry - 1995 |
| Mulgrave | Walkers | GH500 | 613 | 1969 | Mulgrave Mill | Converted by Bundaberg Foundry - 1995 |
| 22 / Aloomba | Eimco | B-BDH | L253 | 1990 | Mulgrave Mill | Rebuilt many times. Last by Mulgrave in 2015 |
| 25 / Cucania | Clyde | DHI-71 | 63-289 | 1963 | Mulgrave Mill | Was Moreton |
| Pie Cart | Mulgrave Central Mill | 4wDM | Out of service | Purchased by Atherton Historical Railway | ||
| 26 / Meringa | Commonwealth Engineering | AK | AK3675 | 1964 | Mulgrave Mill | Was South Johnstone #2 |
| 12 / Riverstone | Commonwealth Engineering | AD | AD1452 | 1961 | Mulgrave Mill | Was South Johnstone #23 |
| 1 | Baguley | BG6 | 3377 | 1953 | Out of service | Being restored by ANGRMS |
| 2 | Commonwealth Engineering | AA | A1001 | 1955 | Out of service | Preserved - Atherton Herberton Historic Railway |
| 4 | Commonwealth Engineering | AA | A1004 | 1955 | Mulgrave Mill | |
| 17 / Deeral | Commonwealth Engineering | AD1453 | AD | 1961 | Mulgrave Mill | |
| Riverstone | Bundaberg Foundry | 1 | 1952 | Out of service | Was Qunaba Jumbo | |
| (Blank) | Motor Rail | 4wDM | 4207 | 1929 | Out of service |
Image Gallery
These images are from Corey Seaton
-
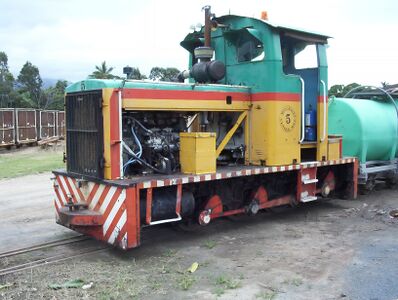 5 (ComEng. AA. A1005 of 1955).
 -
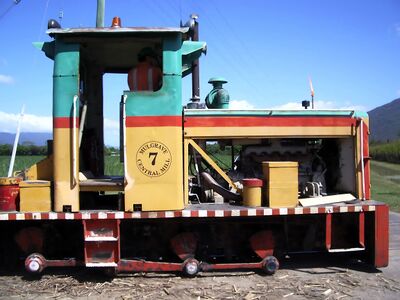 7 (ComEng. AA. B1010 of 1955).
 -
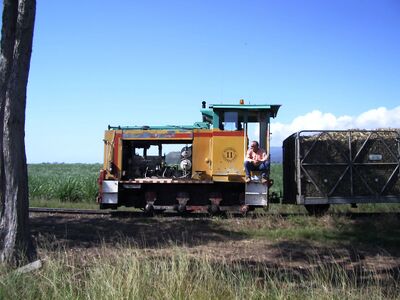 11 (E.M. Baldwin. DH18 Mk2. 4413-2-8-72 of 1972).
 -
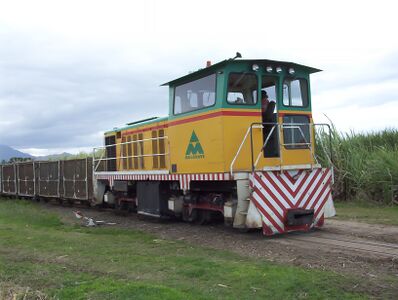 Mulgrave (Walkers. GH500. 613 of 1969).
 -
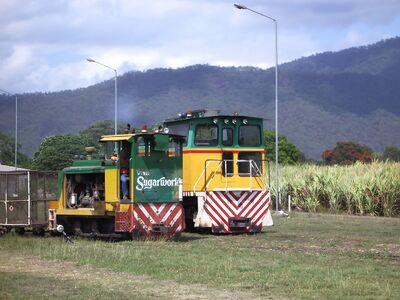 14 (Clyde. DHI-71. 56-86 of 1956).


These images are courtesy of William Thomson


References
- ↑ MSF Sugar. "Mulgrave Mill History". http://www.msfsugar.com.au/our-company/mulgrave-mill/history/
- ↑ The Brisbane Courier. "Sugar Works Guarantee Act". 14 November 1895.
- ↑ Queensland Heritage Register. "Mulgrave Settlers Museum". https://apps.des.qld.gov.au/heritage-register/detail/?id=602558
- ↑ Cairns Post. "The Mulgrave Tramway". 12 August 1911.
- ↑ Mulgrave Settlers Museum. "Gordonvale and the Americans". Exhibition Records, 2014.
- ↑ ABC News. "Mulgrave shareholders vote for MSF merger". 15 May 2008.
- ↑ Australian Financial Review. "Mitr Phol completes MSF Sugar takeover". 23 February 2012.
- ↑ 8.0 8.1 CANEGROWERS, Annual Report 2024–25, table of Australian cane and sugar production.
- ↑ 9.0 9.1 Queensland Cane Agriculture and Renewables, Crush Statistics and Production Figures, 22 January 2025.
- ↑ Queensland Parliament, Parliamentary Debates, 27 November 1991, discussion of the Hambledon closure and Mulgrave throughput.
- ↑ 11.0 11.1 11.2 Queensland Sugar Corporation, annual report, Appendix A: Cane Crushed.
- ↑ CANEGROWERS, 1993 Season Statistics.
- ↑ 13.0 13.1 13.2 Far North Queensland Sugar Industry Task Force, Statistical Picture of the Far North Queensland Sugar Industry in 1999.
- ↑ Mulgrave Central Mill Company, Annual Report, January 2001–June 2002.
- ↑ BSES Limited, post-cyclone crop assessment, Appendix 4: Mulgrave Mill area.
- ↑ Australian Cane Farmers Association, northern region report, December 2014.
- ↑ 17.0 17.1 CANEGROWERS, Annual Report 2016–17, table of Australian production in the 2015 and 2016 seasons.
- ↑ MSF Sugar, Crushing Season a Success Despite Reduced Tonnages, December 2017.
- ↑ Sugar Research Australia, Harvesting Details — 2018 Season.
- ↑ 20.0 20.1 CANEGROWERS, Annual Report 2019–20, table of Australian production in the 2018 and 2019 seasons.
- ↑ CANEGROWERS, Annual Report 2020–21, table of Australian production in the 2019 and 2020 seasons.
- ↑ CANEGROWERS, Annual Report 2021–22, table of Australian production in the 2020 and 2021 seasons.
- ↑ CANEGROWERS, Annual Report 2022–23, table of Australian production in the 2021 and 2022 seasons.
- ↑ CANEGROWERS, Annual Report 2023–24, production table and Innisfail district report.